
My Rules and Notes: I don’t need to worry about HTF now. I have completed the video lessons twice. Now I just need to practice and stay consistent. Remember, it’s easy.
- The Time Frame I am interested is Weekly, Daily, 4Hour, 1Hour, 15Min. Here I can refine my entries from either 15Min, 5Min, 3Min or 1Min zones.
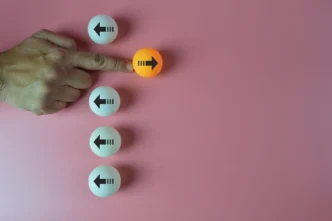
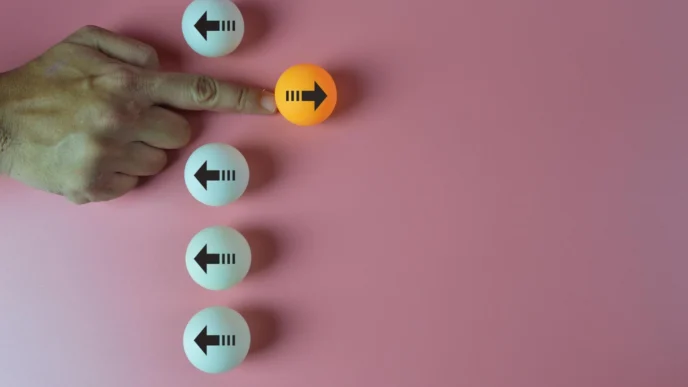
- While observing the weekly candlestick chart, I found an easy cheat code to quickly decide if a candle is bullish or bearish. Just switch to Heikin Ashi.
- The correct way to analyze the weekly chart for top-down analysis is to first focus on the most recent price action and mark the structural bias, rather than looking too far into past price action.
- There are no strict rules for timeframes when refining zones. I can go as low as needed into LTFs. I should focus on clean, inefficient price structures, as the market often fills these areas before making a big move.
- I should practice all three position management methods: Partials, Trailing, and Scaling. But as a beginner, I should start with the simplest one, which is the Trailing method.
High Time Frame: Top-Down Analysis
What is top down analysis?
Top-down analysis is an approach used primarily in investing, trading, and economics where you begin by analyzing the broader picture before narrowing down to specific details.
- Higher Time Frame: Directional Bias.
- Medium Time Frame: Setup Formation.
- Lower Time Frame: Entry Models.
What five sets of time frames should I use then?
Here are some most used time frame combinations:
- Week, Day, 4Hour, 1Hour, 30Min.
- Week, Day, 4Hour, 1Hour, 15Min.
- Day, 4Hour, 1Hour, 30Min, 15Min.
- Day, 4Hour, 1Hour, 15Min, 5Min.
- 4Hour, 1Hour, 30Min, 15Min, 5Min.
- 1Hour, 30Min, 15Min, 5Min, 3Min.
- 1Hour, 15Min, 5Min, 3Min, 1Min.
- 30Min, 15Min, 5Min, 3Min, 1Min.
- 15Min, 10Min, 5Min, 3Min, 1Min.
My ideology is to complete one trade in one day, with small stop-loss, so I need entries from 15Mins zone or lower. I like the The Trading Greek time frames the most which sits in mindset easily and is clean.
Point 1: The Time Frame I am interested is Weekly, Daily, 4Hour, 1Hour, 15Min. Here I can refine my entries from either 15Min, 5Min, 3Min or 1Min zones. ✔
Weekly Time frame – Important (My Observation)
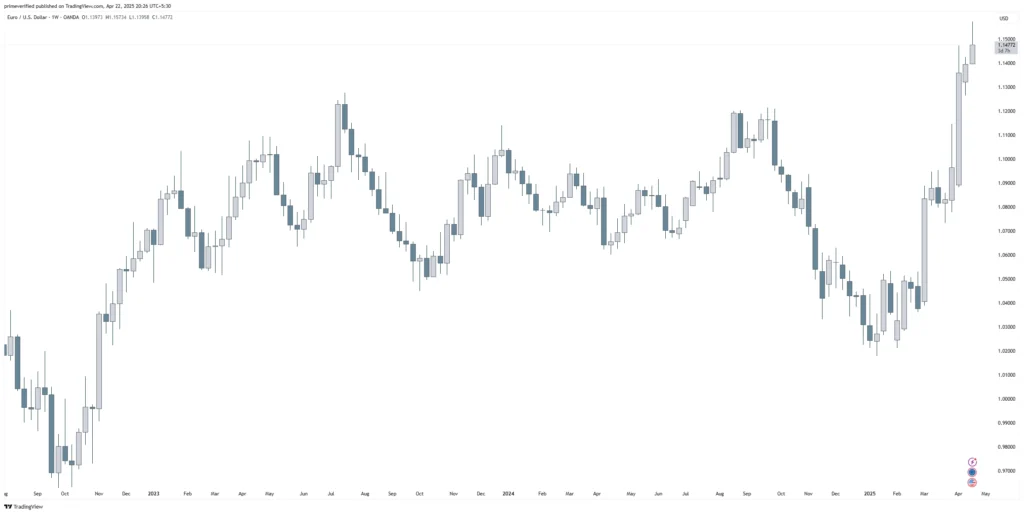
Very Important Note: In the image above, I have to strictly follow one condition on a Weekly chart, each single candle represents price action from Monday to Friday. To create a bias for the upcoming week, I look at the current weekly candle.
- If the current week closing candle is bullish, my bias for the next week will be bullish.
- Meaning taking more long setups than short setups.
- To check trend strength, I look at whether the body is big or small, and the size of the wicks.
- If the current week closing candle is bearish, my bias for the next week will be bearish.
- Meaning taking more short setups than long setups.
- To check trend strength, I look at whether the body is big or small, and the size of the wicks.
- Extra Example: If current week candle is bullish, we will see that upcoming next weeks Monday, Tuesday, Wednesday maybe bearish but we can go try bullish setup on Thursday as 3 days went bearish. This idea is just like a probability factor (count factor) for catching the trend and go for a extra accuracy.
- If I am confused then just change the current week candlestick to Heikin Ashi once to confirm.
Point 2: While observing the weekly candlestick chart, I found an easy cheat code to quickly decide if a candle is bullish or bearish. Just switch to Heikin Ashi. That’s it. ✔
How to start analyzing weekly time frame chart?
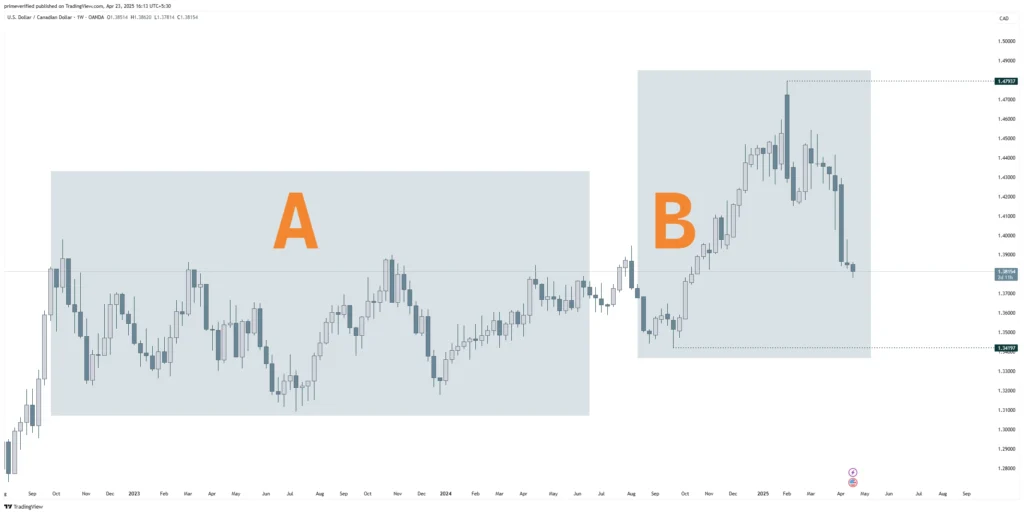
Let’s see how a weekly chart is analyzed:
A – This is the past price action area where I should focus less, just identify the liquidity and (Demand/Supply) zones.
B – This is the latest price action area where I should focus more, mark high and low, mark the structure bias.
The whole idea behind analyzing the chart is that one trade should be completed within one day or week and not more than period. Being just a day and swing trader.
Point 3: The correct way to analyze the weekly chart for top-down analysis is to first focus on the most recent price action and mark the structural bias, rather than looking too far into past price action. ✔
Refining Zones rules and checklist
Learning from above image:
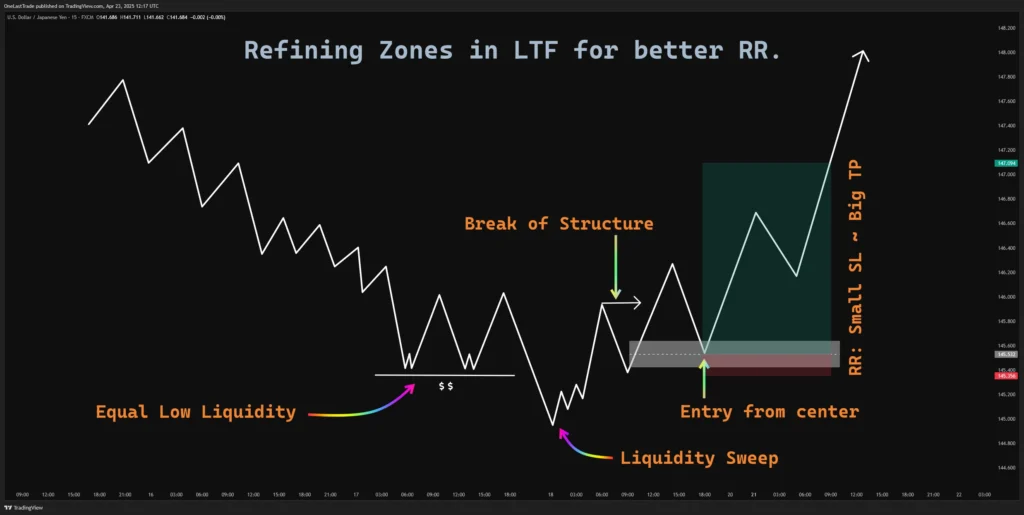
After identifying the HTF bias, we usually look for zones to take entries. However, HTF zones are often large in terms of points, so to achieve a smaller stop-loss and a larger reward, I should step down to the LTF and refine the zone size there, while ensuring all conditions are still met.
- Look for equal low liquidity as a sign that the trend is losing control.
- Wait for the market to do a liquidity sweep.
- Wait for the market to make a Break of Structure (BoS).
- Analyze the structure to mark the zone:
- We want to use the efficient and inefficient concept to mark the correct zone. But we have to take entries from the inefficient price zone only.
- In an efficient structure, we see price do a push-up, pullback, and retest. So, this structure is completed. Therefore, this zone is invalid for me.
- In an inefficient structure, we see price do a push-up but fail to pull back and retest. So, this is the zone we are interested in. Therefore, this zone is valid for me, and I should take trade entries from here.
Point 4: There are no strict rules for timeframes when refining zones. I can go as low as needed into LTFs. I should focus on clean, inefficient price structures, as the market often fills these areas before making a big move. ✔
Trade Management
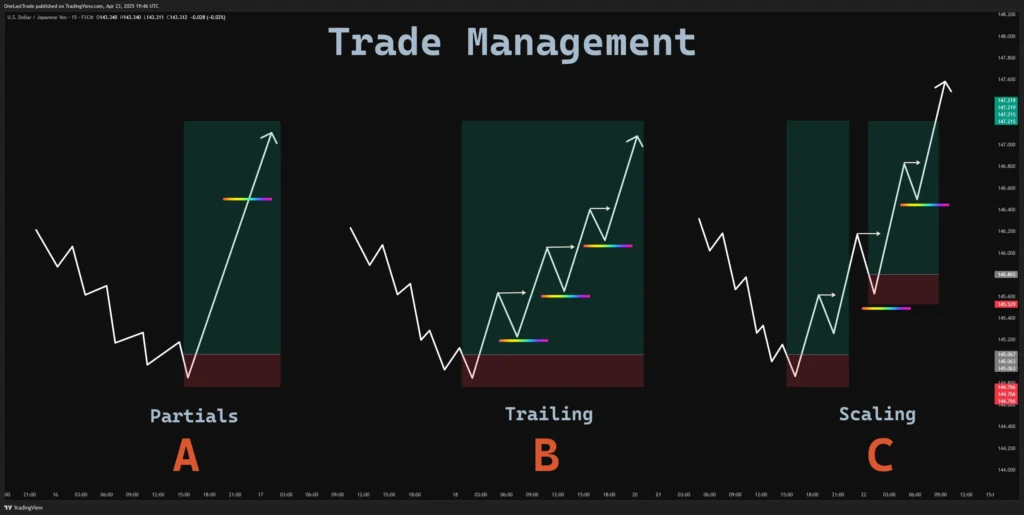
Learn when I should take partials, trailing and scaling.
A – Use Partials when there is an impulse move after my entry. Book 70% of profits and take remaining 30% to target.
B – Use Trailing method to move full position with price. In First BoS, move full position to breakeven, in Second BoS move full position below the Higher Low and so on according to image.
C – Use Scaling when I want to add extra positions after the first entry. Now use the Trailing method to move full position to breakeven, then below the Higher Low as seen in the image to make it a risk free trade and still secure some profit from first entry if trade reverses.
Point 5: I should practice all three position management methods: Partials, Trailing, and Scaling. But as a beginner, I should start with the simplest one, which is the Trailing method. ✔
Closing Comment.
After completing the HTF video series, I feel like I’m getting better at trade entry models. To take a trade, we don’t have to stick to a specific timeframe. We can shift from HTF to any LTF as long as the refined zones make sense and are logical. There’s no need to stop at the 15-minute chart. We can go even lower to 10, 5, 3, or 1 minute for entries and engineer them to achieve a big RR.
Lastly, I have to practice Very Aggressive Entry Model by The Trading Greek and a Breaker Block Trading from Howtotrade website. That all, now practice it.