
My Rules and Notes: This is my one of the best notes on multi-timeframe market structure. So, do practice it consistently.
- A RUN on a HIGHER timeframe is a TREND on a LOWER timeframe. This means that the HTF trend is first formed on LTF.
- The multi-timeframe strategy can be used on any timeframe sets like (4H, 1H, 15m) or (4H, 15m, 5m) or (1H, 15m, 5m) because market structure is a fractal.
- Choose one method, either Range or Pivot, whichever works best for me and stay consistent with it.
- Don’t trade every single zone, only trade the high probability ones that are backed by financial institutions and smart money itself.
- The more confluences we have, the higher the probability of the zone working.
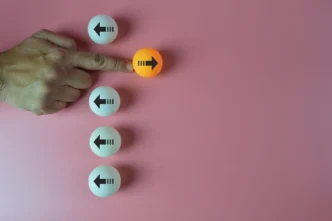
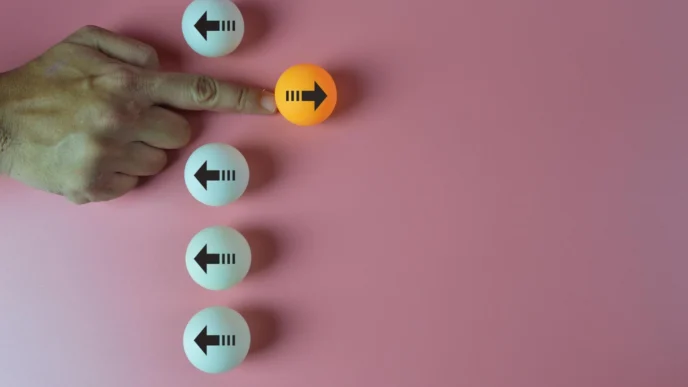
Multi-Timeframe Market Structure
A Run on a HTF is a trend on a LTF.
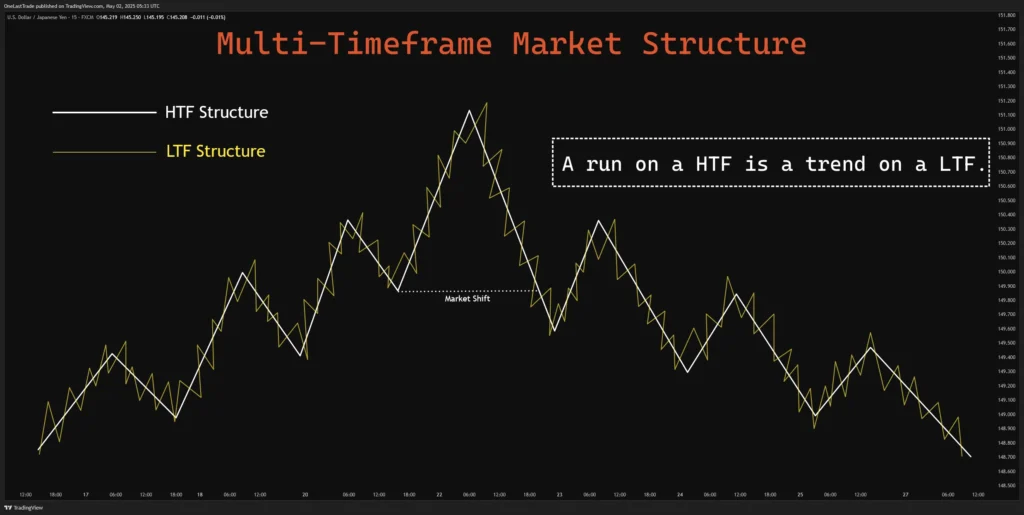
Learning from above image:
- Within the main HTF trend there is a mini LTF trend.
- What happens on HTF must happen on LTF first.
Important Note: A RUN on a HIGHER timeframe is a TREND on a LOWER timeframe. This means that the HTF trend is first formed on LTF.
Identifying Multi-Timeframe Market Structure: 1-2-3 Boom
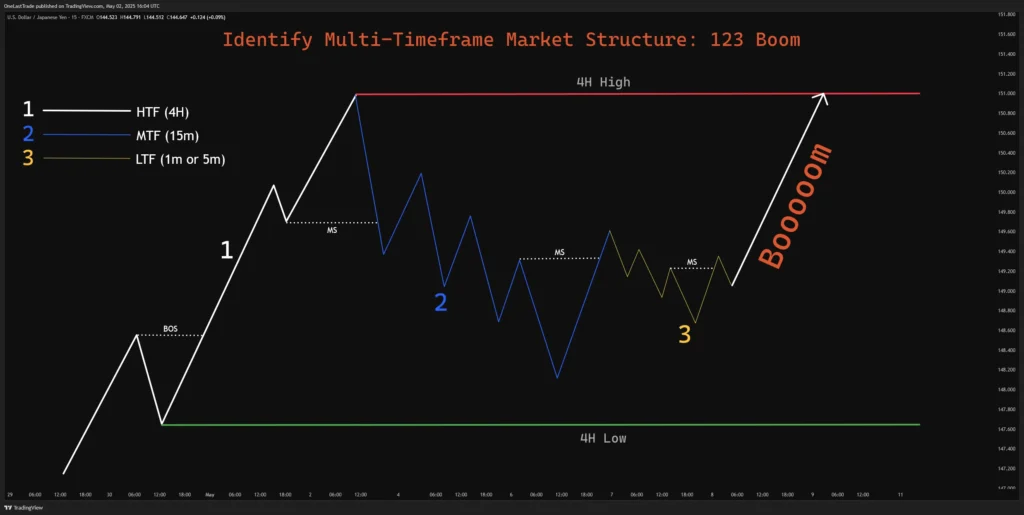
Learning from above image:
- In an uptrend, mark the swing range: 4H Low and 4H High.
- The condition for marking the 4H Low (HTF) is that it should cause a Break of Structure.
- The condition for marking the 4H High (HTF) is that it should pull back and create a market shift.
- Use a Premium-Discount Tool to identify the discounted area.
- Move to the 15m timeframe (MTF) and wait for the price to make a market shift to the upside.
- Mark the 15m high and low range using the same market structure theory.
- Again, use a Premium-Discount Tool to identify the discounted area.
- Now, the 4H(HTF) and 15m(MTF) trend is aligned.
- Move to the 1m or 5m timeframe (LTF), wait for a pullback to the downside, and then for the price to create a market shift to the upside.
- Now, the 4H (HTF), 15m (MTF), and 5m (LTF) trends are aligned.
- Finally, enter a long position from an inefficient zone and target the 4H High.
Steps to understand the Multi-Timeframe strategy more easier
Our main objective is to identify the bias, ensure that all timeframe trends are aligned, and take entries with the tightest stop-losses only in discounted areas.
- The 4H (HTF) trend is bullish, so the bias is to go long. Mark the 4H (HTF) Low and High.
- The 15m (MTF) structure should make a market shift to the upside to align with the bullish bias.
- The 1m or 5m (LTF) structure should also make a market shift to the upside to align with the bullish bias.
- Now the 4H (HTF), 15m (MTF), and 1m or 5m (LTF) trends are all aligned bullish.
- So, 1-2-3 Boom.
Important Note: The multi-timeframe strategy can be used on any timeframe sets like (4H, 1H, 15m) or (4H, 15m, 5m) or (1H, 15m, 5m) because market structure is a fractal.
Supply and Demand Zone: The four concepts of Order Flow
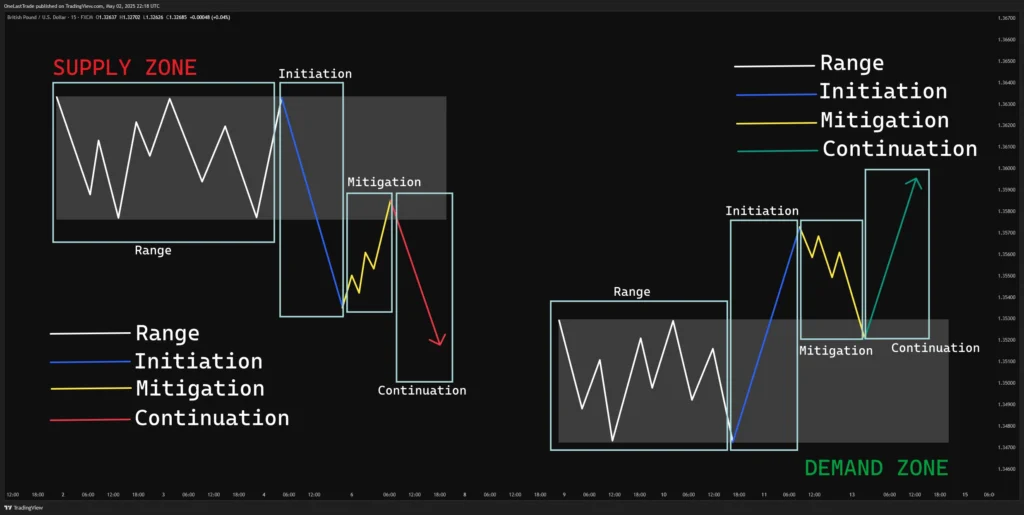
Learning from above image:
In the Supply and Demand Zone lesson, there are four main concepts of Order Flow: Range, Initiation, Mitigation, and Continuation.
1. Range
Price consolidates within a defined high and low. This phase represents accumulation or distribution — institutions are quietly building or unloading positions.
2. Initiation
A strong move breaks out of the range, creating imbalance. This signals aggressive buying or selling, revealing institutional intent and forming the base of a demand or supply zone.
3. Mitigation
Price retraces to the origin of the move (the zone) to fill unfilled orders. This allows institutions to mitigate risk, rebalance, or scale into positions at better pricing.
4. Continuation
After mitigation, price resumes in the direction of the initial move. This confirms the trend and provides follow-up trade opportunities in alignment with order flow.
Understanding Supply and Demand Patterns
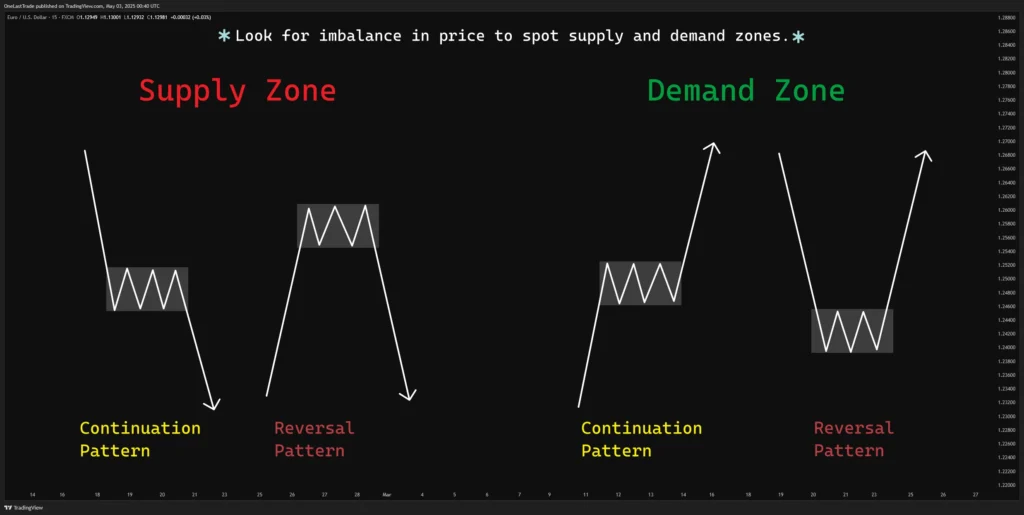
Learning from above image:
Question: How to spot Supply and Demand Zones?
Answer: Look for imbalance in price to spot supply and demand zones. We want to see price break out of consolidation and shift from balance to imbalance, as this indicates that smart money has entered the market.
Question: How to draw Supply and Demand Zones?
Answer: There are two ways to draw Supply and Demand Zones which are Range method and Pivot method.
Range Method:
- Mark the entire consolidation area using the highs and lows, focusing on a cluster of candles.
- Clusters of candles generally offer lower risk-to-reward (RR) ratios but provide more frequent trading opportunities.
Pivot Method:
- This method refines the supply or demand zone to a single pivot candle and draws the zone from that specific candle. A pivot-based zone is similar to an order block.
- More refined zones result in higher RR ratios but also come with a higher chance of missing the trade.
Important Note: Choose one method, either Range or Pivot, whichever works best for me and stay consistent with it.
High Probability Supply and Demand Zones
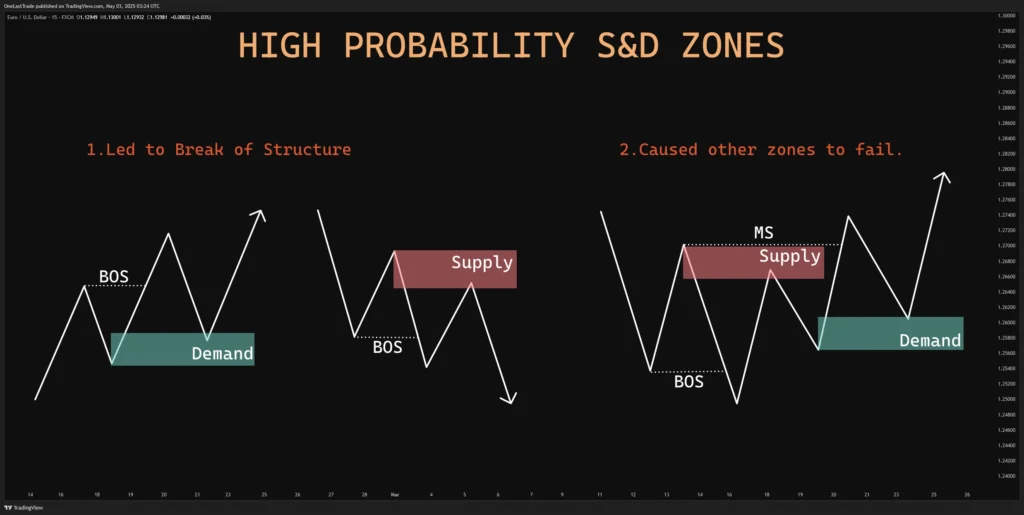
Learning from the above image:
In order for a zone to be considered as a high probability institutional S&D zone, it has to meet the following requirements.
1 – Led to Break of Structure:
- It must lead to a Break of Structure to considered as high probability S&D zone.
2 – Caused other zones to fail:
- The zone must cause other zones to fail, this is what we call Flip Zones.
- Flip Zones are being created after a failed reaction.
- According to image example, Price has officially shifted from bearish to bullish and created a demand zone.
- Now, this demand zone is a high probability zone because it caused supply to flip to demand.
Important Note: Don’t trade every single zone, only trade the high probability ones that are backed by financial institutions and smart money itself.
There are additional confirmations that will increase the probability of a zone or point of interest (POI) working:
- Market Structure (bullish/bearish, continuation/pullback phase)
- Multi-Timeframe Concepts (HTF narrative)
- Premium & Discount (Buying from Demand in Discount, Selling from Supply in Premium)
- Mitigation (Unmitigated? Part of S&D chain?)
- Liquidity (Swept liquidity? Inducements present?)
- Order Flow (With or against it?)
Important Note: The more confluences we have, the higher the probability of the zone working.
Closing Comment.
This is my one of the best and special notes understanding market structure. I should learn and practice it. Then I can do 1-2-3 Boom.