My Rules and Notes: Understanding liquidity helps me see where the market is likely to hunt next for orders. I’ll use this concept to confidently capture opportunities. I enjoy it as it makes me feel brave and secure in my trades.
- Retail orders are small and have little impact on the market. Institutional orders are massive and can’t be filled all at once. To execute efficiently, institutions need liquidity. They trap retail traders and hunt stop-losses to fill their positions.
- Learn more about liquidity at The Trading Greek: Liquidity Video. Another important point is that which liquidity area is the best? The answer is which is nearest to extreme zone.
Liquidity Concept.
what is liquidity in trading?
In trading, liquidity refers to how quickly and easily an asset (like a stock, currency, or crypto) can be bought or sold without significantly affecting its price.
What makes a zone a liquidity target?
Liquidity zones are key areas on a chart where lots of orders (buy or sell) are likely sitting, and smart money (like institutions) often targets these areas to fill their big orders.
A liquidity zone is a price area where:
- Many stop-losses are clustered (e.g., below swing lows or above swing highs).
- Many pending orders (buy limits, sell stops) are waiting to be triggered.
These zones become targets for:
- Stop hunts (grabbing liquidity before reversing).
- Market structure shifts.
- Breakouts or fakeouts.
So, to understand liquidity more clearly, we have to look at how retail traders trade versus how institutions like banks do.
Retail Traders Concept.
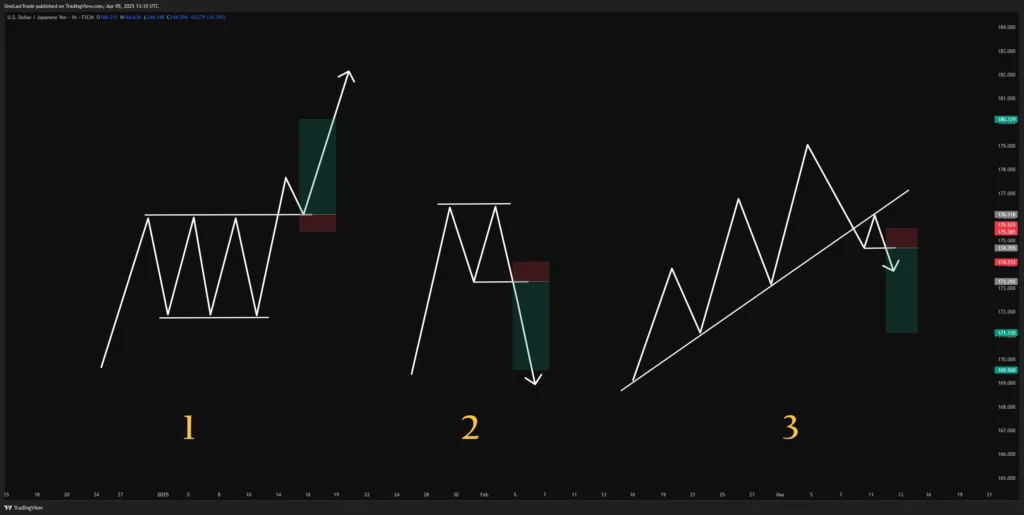
Learning from above image:
- Most retail traders wait for a range breakout and retest before entering a trade. Resistance becomes support, and they buy from there.
- Retail traders often trade the double top and neckline breakdown. Sell orders are triggered there, and the market moves down.
- This is a trendline retest and a trend break. To trade a trendline break, traders generally wait for the trendline to be broken, then look to sell on the retest, expecting the market to form a new downtrend.
Institutional Trader Concept.
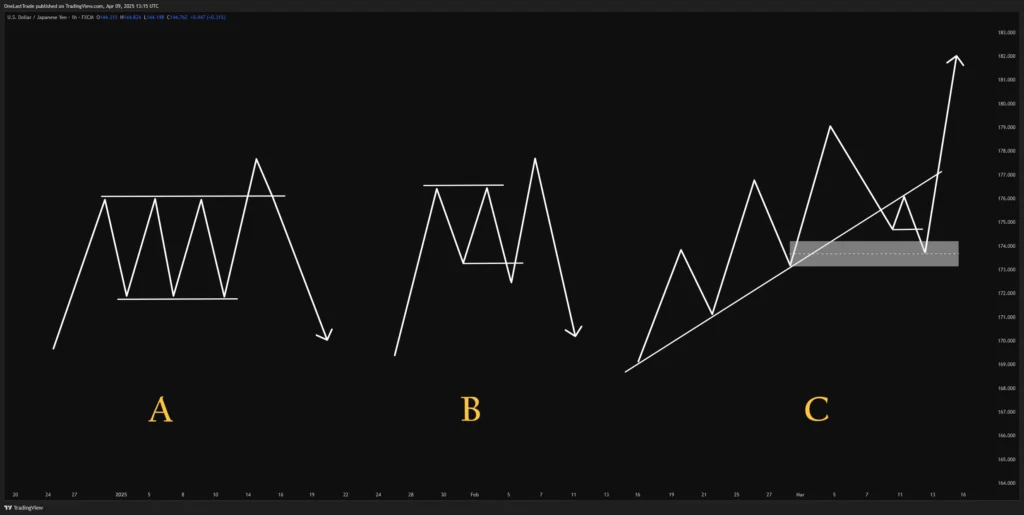
Learning from above image:
A – Institutional traders often engineer a range breakout to trap retail buyers. Instead of buying the breakout, they wait for liquidity above the highs, then reverse the market from that zone.
B – When retail traders sell a double top and neckline break, institutions lure them in with a short move down. Then, they reverse the price upward, hunting retail stop-losses. Price is pushed above the range to attract breakout buyers, and once enough liquidity is collected, institutions drive the market lower.
C – On a trendline break, institutions wait for retail traders to sell the retest. Once enough sell-side liquidity builds up, they buy into it, causing a reversal and continuation in the original trend direction. (Note: A trendline is just an imaginary line drawn based on retail concepts. Institutions focus on zones to collect orders and liquidity.)
Point 1: Retail orders are small and have little impact on the market. Institutional orders are massive and can’t be filled all at once. To execute efficiently, institutions need liquidity. They trap retail traders and hunt stop-losses to fill their positions. ✔
How Liquidity Concept can help me?
Liquidity isn’t used as a direct trade signal, but as a tool to spot key areas where price is likely to move from and to. It helps us build a stronger view of the market and boosts confidence in our trades, leading to better performance.
By understanding where liquidity sits and how the market reacts around it, we gain an edge.
To recap, we’re watching for basic retail patterns like support and resistance, trendline breaks, retests, double tops, double bottoms, triangles, and flags. These are common patterns that retail traders focus on. We bring that perspective into the live markets, identify where retail traders are active, and find the liquidity surrounding those setups.
We don’t trade those patterns directly, because they often fail. Instead, we use them to understand where price might push through, trigger trades, and ultimately give us higher-confidence setups for our own trading.
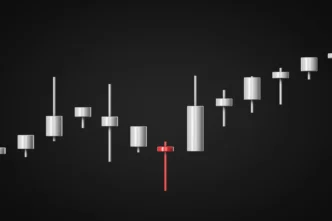
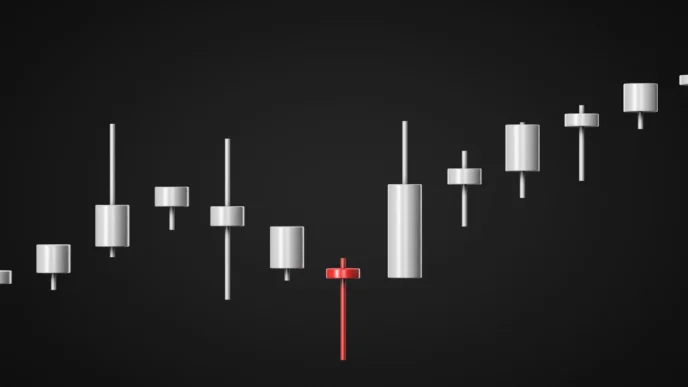
My Observation and Experience in Live Market about Liquidity:
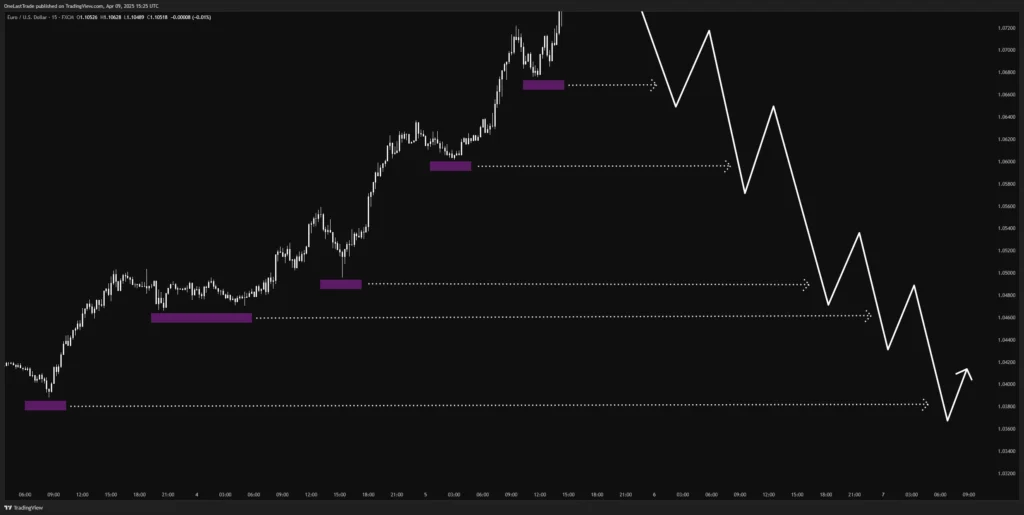
In the image above, the colored boxes represent liquidity (stop-loss orders). As the market moves down, it sweeps through each liquidity zone one at a time. Liquidity often sits below swing lows or below the takeoff point as in the image.
This idea helps me spot fresh liquidity zones, understand which ones the market has already swept, and what it might be targeting next. It also helps improve my target areas and risk-reward with a clear reason behind the trade.
I just need to keep practicing this concept in the live market.
Closing Comment.
Learning about liquidity is actually sweet. It gives me extra confidence in spotting where the market might hunt or head next. Now I just need to practice it live in the markets. Ta-da!