
My Rules and Notes: Market Efficiency concepts bring an added layer of value to classic Price Action and Dow Theory. I need to practice.
- Market efficiency means balanced buying and selling. Market inefficiency means buying and selling are imbalanced.
- Trading from valid buying and selling zones is good, but to increase the probability of a successful trade, it’s better to also consider imbalanced (inefficient) zones where price is likely to pull back to avoid getting stopped out.
- Knowing the concepts of Efficient and Inefficient Price Action is important for identifying the most favorable and valid zones, avoiding losses, and finding high-quality entries.
- By using the concept of Inefficient Price Action, we can confidently buy or sell against the main Higher Timeframe trend by leveraging sub-structure bias, spotting imbalances, and identifying retail traps.
Market Efficiency in Price Action:
What is market efficiency in price action?
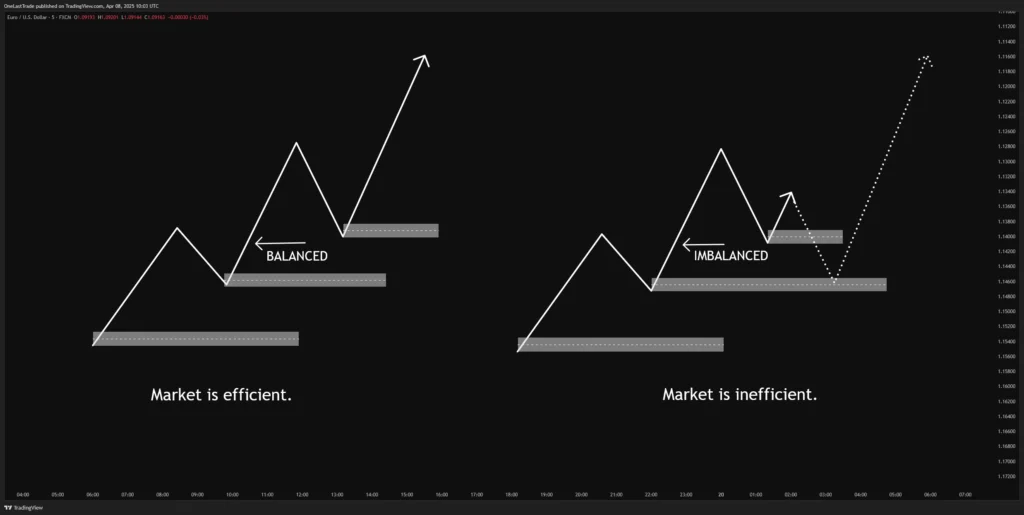
A market is efficient when price moves smoothly, with balanced buying and selling, leaving no gaps or imbalances behind.
What is market inefficiency in price action?
A market is inefficient when price moves leave imbalances or gaps, showing that not all buying and selling was completed, which may lead price to revisit those areas.
Point 1: Market efficiency means balanced buying and selling. Market inefficiency means buying and selling are imbalanced. ✔
So I should focus more on Market Inefficiency and here are some images related to it below:
Market Inefficient in Uptrend.
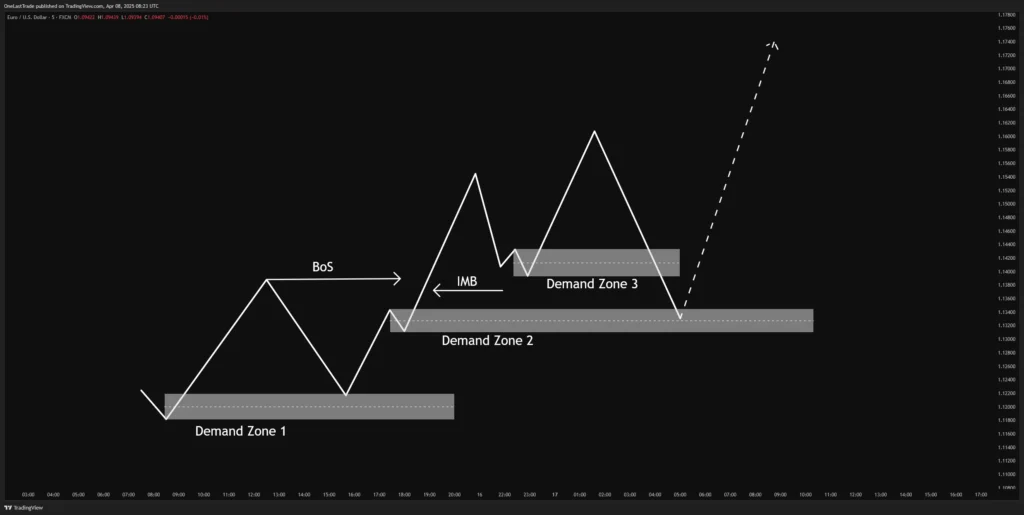
This uptrend chart shows an inefficient market.
- The chart highlights a large IMB (Imbalance) between Demand Zone 2 and Demand Zone 3, which is a key sign of inefficient price action.
- The large gaps between price swings suggest unfilled buy orders, the market skipped levels and didn’t fully process orders in those areas.
- In this case, price is likely to return to fill the imbalance, as shown by the downward move toward Demand Zone 2 before potentially moving higher again.
Market Inefficient in Downtrend.
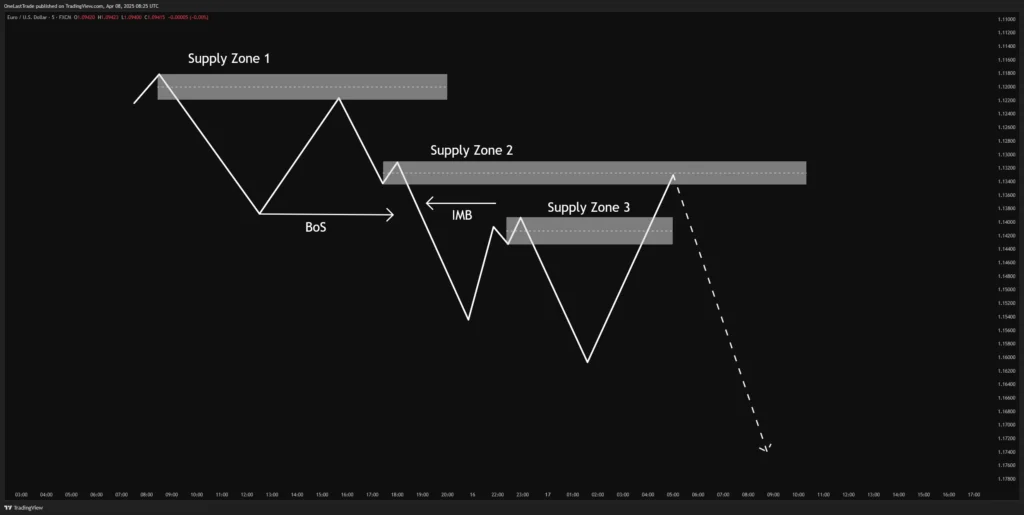
This Downtrend chart shows an inefficient market.
- The chart highlights a large IMB (Imbalance) between Supply Zone 2 and Supply Zone 3, which is a key sign of inefficient price action.
- The large gaps between price drops suggest unfilled sell orders, the market skipped levels and didn’t fully process orders in those areas.
- In this case, price is likely to return to fill the imbalance, as shown by the upward move toward Supply Zone 2 before potentially dropping again.
Point 2: Trading from valid buying and selling zones is good, but to increase the probability of a successful trade, it’s better to also consider imbalanced (inefficient) zones where price is likely to pull back to avoid getting stopped out. ✔
Efficient Price Action and Inefficient Price Action.
When it comes to market efficiency, the market can be in one of two phases: Efficient Price Action or Inefficient Price Action.
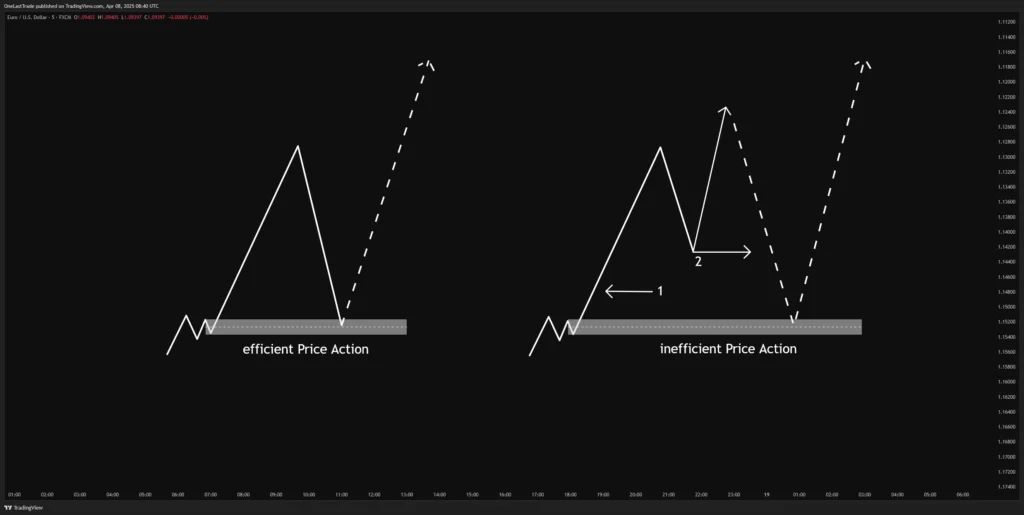
Explanation according to image above:
Efficient Price Action is when the market moves away from a zone, then returns to retest it. This is the cleanest and easiest type of price action to work with, and it happens quite often.
Inefficient Price Action is when the market forms a demand zone, moves away, and fails to retest it, leaving behind a price area known as inefficient pricing. During this move, an injection of buying pressure occurs above the demand zone, but the market moves based on pending orders. Eventually, the market pulls back to the zone that created the imbalance in order to fill the remaining buy orders.
So 1 and 2 in Inefficient price action are:
1. The market creates inefficient pricing through imbalances or large candles.
2. The market injects more buy orders above the demand zone, but if this is not enough to push the market higher, it pulls back to the original imbalance zone to collect the remaining pending buy orders.
Point 3: Knowing the concepts of Efficient and Inefficient Price Action is important for identifying the most favorable and valid zones, avoiding losses, and finding high-quality entries. ✔
Example of Real Market Inefficiency in Downtrend.
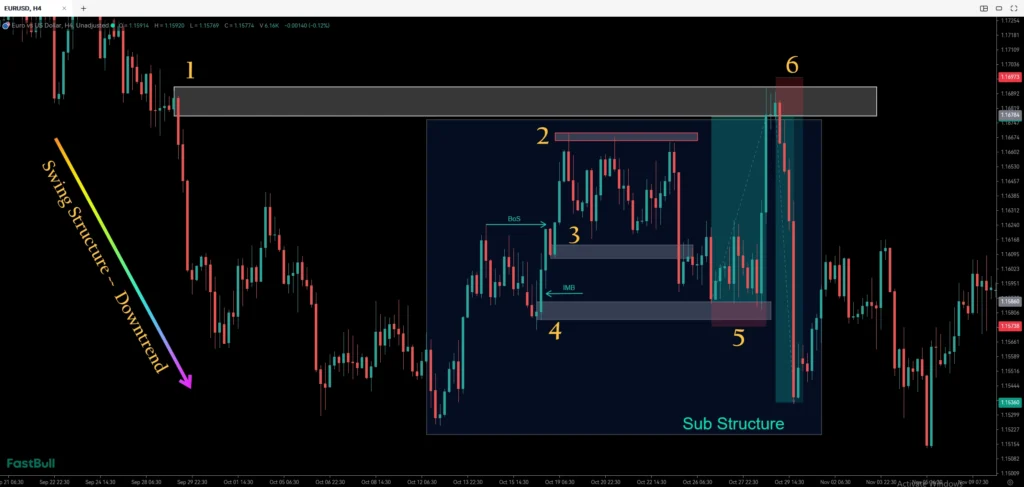
Note: This is the EURUSD 4Hr Chart on date 18 OCT 2021, example taken from FastBull website.
When analyzing the example image above, the market is in a swing structure downtrend, with a sub-structure showing an upward pullback to collect the remaining sell orders.
Let’s go through the marked numbers in the image to understand it better:
- This is the Supply Zone in a downtrend. To further validate it, we can also see that it created imbalanced candles.
- This is a triple top, a common retail concept where traders look to sell.
- This is a Demand Zone that broke structure. We can identify and mark this zone on the 1-hour timeframe.
- This is another Demand Zone, located below the break of structure, but with a clearer imbalance candle. We can identify and mark this zone on the 1-hour timeframe. (So now the question is: Which zone should I buy from, Demand Zone 3 or 4? The answer is: Both are valid, but often the market comes down to the second zone, giving us a better opportunity. The goal is simply to let price hit those zones and see how the market reacts. There’s no need to be too picky.)
- Here, we can take a buy trade up to the Supply Zone, because we know the Higher Timeframe Swing Structure is bearish, the Sub-Structure is bullish, and there’s still an imbalance at Supply Zone 1. So, buying from Demand Zone 4 makes sense, as it also contains an imbalance.
- Here, we can take a sell trade from this Supply Zone and ride the move downward, following the basic concept of selling from supply. To add more confluence, the zone also contains an imbalance, and the major higher timeframe trend is clearly in a downtrend.
So, what’s the most important lesson I’ve learned from this example?
The most important lesson I’ve learned is to understand Efficient and Inefficient Price Action, as it helps in observing and understanding market behavior. The market moves continuously back and forth, collecting buy and sell orders to fuel the ongoing battle between buyers and sellers.
I also learned to take advantage of both buy and sell opportunities in a downtrend, as long as there are valid confluences. In a downtrend, I now understand why a buy trade can still make sense, because the sub-structure is bullish, there’s a well-formed demand zone with imbalance, and a triple top setup that often traps retail traders.
Point 4: By using the concept of Inefficient Price Action, we can confidently buy or sell against the main Higher Timeframe trend by leveraging sub-structure bias, spotting imbalances, and identifying retail traps. ✔
Closing Comment.
Understanding Market Efficiency and Inefficiency has shown me the importance of analyzing market structure across multiple timeframes. By aligning swing structure, sub-structure, supply and demand zones, and imbalances, I can make more confident and well-timed trading decisions.
Need time to practice more….!!!