

My Rules and Note: I used to think inducements and liquidity concepts were difficult, but after learning them, I find them much easier and their logic fits well with smart money concepts.
- Always look for Inducements at Point of interest (POI).
- Smart money, such as banks and financial institutions, entices retail traders by using obvious chart patterns like double tops, double bottoms, or support and resistance levels. Essentially, all these retail concepts are used to lure traders into entering positions too early.
- If you can’t identify the liquidity, then you are most likely the liquidity.
- Liquidity areas can often be found in common retail patterns such as equal highs and equal lows, swing highs and swing lows, trendlines, and support and resistance levels.
- Always analyze charts using this five-step process: Market Structure, Points of Interest (Order Blocks, Supply & Demand zones), Inducements, Liquidity, and Entries & Exits.
Inducements
Inducements are basically traps for retail traders, where smart money entices market participants to enter for trades and transact at certain levels.
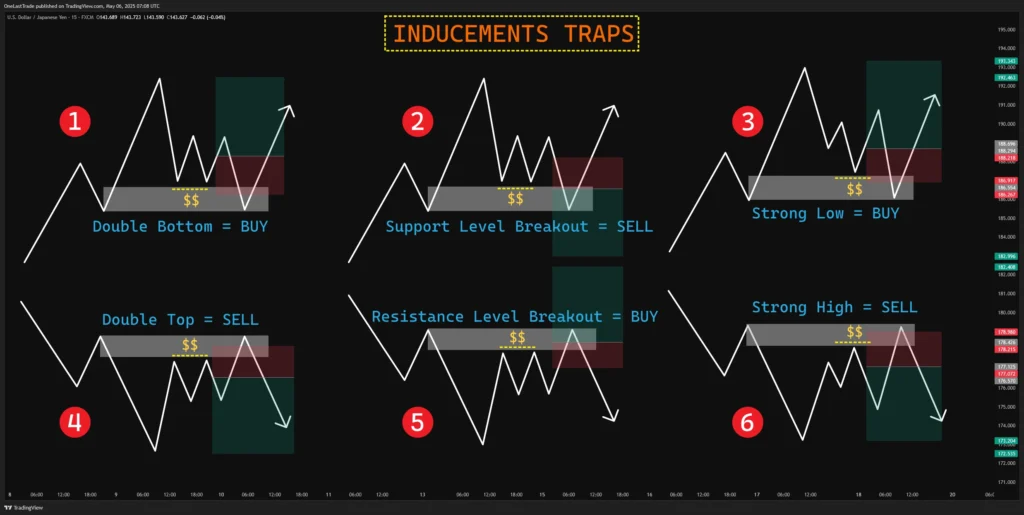
Learnings from the above image:
See how retail trader gets trapped by financial institutions in this way smart money is able to generate a large amount of liquidity in order to fuel their large positions. (Retailer Patterns Trap = Institutions filling their orders.)
- Retailers Buy at the Double Bottom & SL below the Double Bottom.
- Retailers use Sell Stop at the Support Level Breakout.
- Retailers Buy at the Swing Strong Low.
- Retailers Sell at the Double Top & SL above the Double Top.
- Retailers use Buy Stop at Resistance Level Breakout.
- Retailers Sell at Swing Strong High.
Pro Tip: Always look for Inducements at Point of interest (POI).
Important Note: Smart money, such as banks and financial institutions, entices retail traders by using obvious chart patterns like double tops, double bottoms, or support and resistance levels. Essentially, all these retail concepts are used to lure traders into entering positions too early.
Liquidity Concepts
Question: What exactly is liquidity?
Answer: I must understand that for every buyer, there must be a seller, because a seller is needed to fulfill my buy order. This also means that for every winner, there will be a loser. That is how trading works. Every time I lose a trade, I am essentially adding liquidity to the market.
Liquidity is not a problem for retail traders like us, since we are not trading with large sums of money. However, it becomes a problem for big financial institutions because they trade with millions of dollars.
Key points on liquidity:
- Liquidity is a problem for smart money, not for retail traders.
- Smart money will cause you to lose your trades in order to add liquidity into the market to fulfil their large orders.
- Liquidity = pending buy/sell orders + stop losses.
Liquidity Zones
Liquidity zones are areas where resting pools of orders are located and where institutional activity may have taken place.
As traders, our job is to:
- Follow the footprints of institutional traders, big banks, and smart money.
- Understand that these players are responsible for major market moves.
- Trade with them, not against them, by aligning ourselves with their intentions.
- Recognize and properly identify liquidity zones, which reveal where they may enter or exit positions.
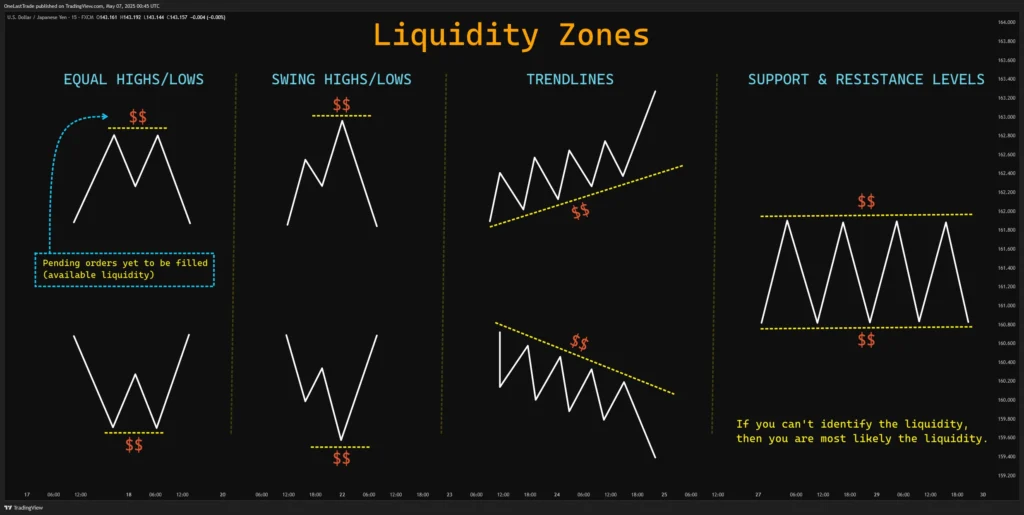
Learning from the above image:
Common areas where liquidity is likely to be found include:
- Equal highs and equal lows
- Swing highs and swing lows
- Trendlines
- Support and resistance levels
These areas often contain resting (pending) orders that have yet to be filled, this is what we refer to as available liquidity.
Pro Tip: If you can’t identify the liquidity, then you are most likely the liquidity.
Important Note: Liquidity areas can often be found in common retail patterns such as equal highs and equal lows, swing highs and swing lows, trendlines, and support and resistance levels.
Steps to take account when applying liquidity concepts
Always approach analyzing charts in this order as below: (Very Strict)
- Market Structure: Trend Direction (bullish or bearish, pro-trend or counter-trend)
- Point of Interest(OB, S&D zones): Where large orders are entering into the market.
- Inducements: Price moves designed to lure retail traders into entering positions prematurely, often just before a reversal or smart money entry.
- Liquidity: Where resting pools of orders are sitting & where smart money got involved.
- Entries & Exits: Enter near points of interest after liquidity is taken and structure confirms, Exit at opposing zones or liquidity areas with clear risk-to-reward.
Important Note: Always analyze charts using this five-step process: Market Structure, Points of Interest (Order Blocks, Supply & Demand zones), Inducements, Liquidity, and Entries & Exits.
Closing Comment.
I think I got the main (Perfect Five-Step Order Process) to analyze any market charts to be a profitable trader. Which are Market Structure, Points of Interest (Order Blocks, Supply & Demand zones), Inducements, Liquidity, and Entries & Exits.
Let’s me include 5-step process in main trade development checklist…That’s all.