My Notes:
- Moving averages are lagging indicators, often introduced to mislead traders.
- A single moving average or crossover strategy only indicates a trend change but does not provide an exact entry signal at the crossover point.
- Focus solely on candlestick behavior to understand market movements. Keep my chart clean, without unnecessary indicators, and aim to capture full swings.
- If using moving averages, only apply them on higher timeframes like 4H, Daily, or Weekly for better accuracy.
- Remember, any indicator or crossover or any strategy using with indicators will only give scalping move, we can’t catch big moves. So, avoid it.
- Remember, don’t chase candlesticks for points. Use only risk-reward to capture points. I should change my view and mindset accordingly. Opportunities are endless, but capital is not.
Let’s learn about moving averages and how they help us in our trading decisions.
What is an Moving Average?
A moving average (MA) is a technical indicator that smooths price data by calculating the average price of a security over a specific period. It helps traders identify trends by minimizing short-term fluctuations and highlighting the overall market direction.
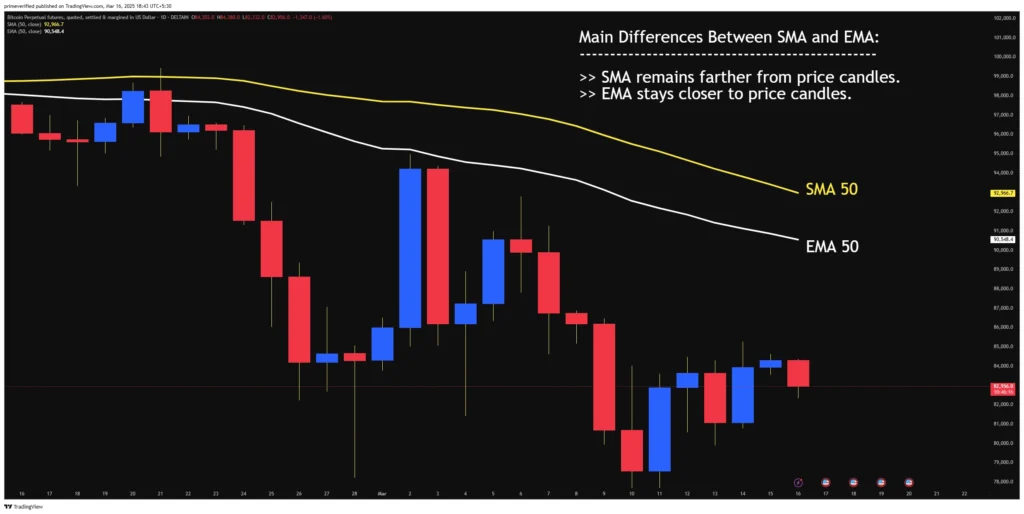
What is the difference between SMA and EMA?
The two main types of moving averages are: SMA and EMA.
- Simple Moving Average (SMA): Calculates the average price over a set period, giving equal weight to all data points.
- Exponential Moving Average (EMA): Assigns more weight to recent prices, making it more responsive to market changes.
Quick Comparison Table: SMA Vs EMA.
| Feature | Simple Moving Average (SMA) | Exponential Moving Average (EMA) |
|---|---|---|
| Calculation | Averages all prices equally | Gives more weight to recent prices |
| Responsiveness | Slower to react to price changes | Faster response to price changes |
| Lag | More lag due to equal weighting | Less lag, reacts quickly |
| Position to Candles | Farther from price candles | Closer to price candles |
| Suitability | Best for long-term trend analysis | Preferred for short-term and volatile markets |
| Sensitivity | Less sensitive to recent price changes | More sensitive to recent price movements |
| Use Case | Identifying overall trends | Generating quick trading signals |
Next, let’s study crossover observation of SMA and EMA in daily timeframe separately. I have used and spent more time moving averages.
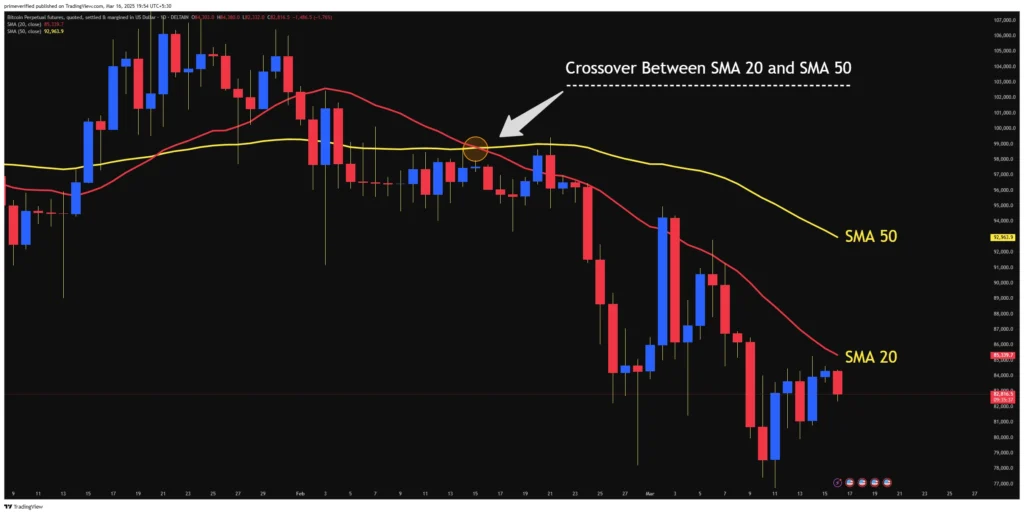
SMA 20 and SMA 50 Crossover:
EMA 20 and EMA 50 Crossover:
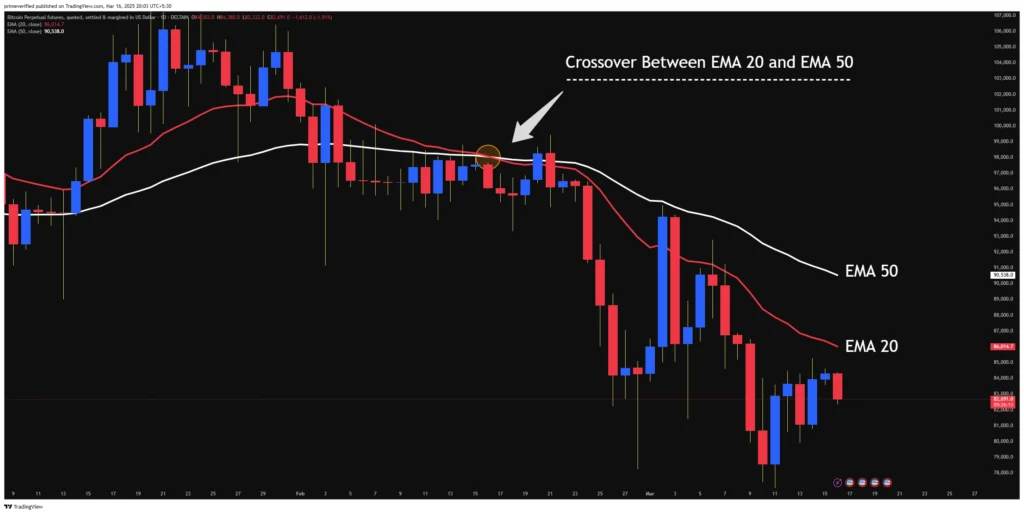
Comparing both the above chart SMA 20/50 and EMA 20/50 crossover, let’s see what I got?
1 – Even if the EMA is more reactive to the price candles, but SMA’s crossover came first. (look carefully both the crossovers.)
Instead of getting confused about which one is better, I need to stick to either one – SMA or EMA.
2 – I see two crossovers in SMA chart image and only one crossover in EMA chart image.
I thought EMA would give more crossovers than SMA because it reacts faster, but the situation here is different. (I’m confused about which one to use.) So, I will choose the moving average that gives fewer crossovers than the others.
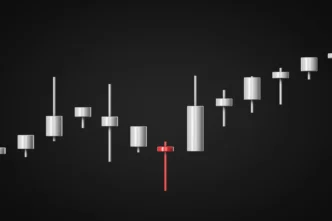
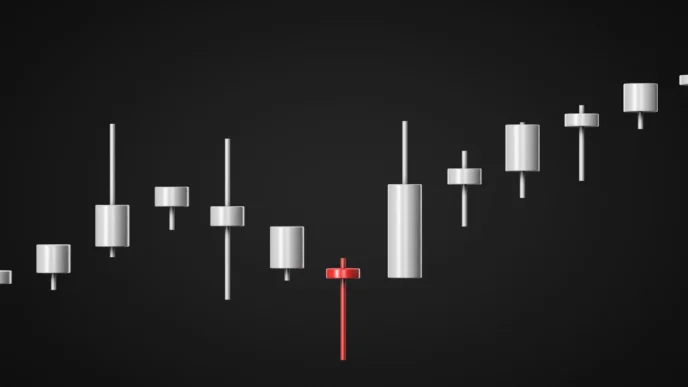
3 – I observed that the moving average crossover strategy doesn’t guarantee success every time. The failure rate is higher. (see the image below)
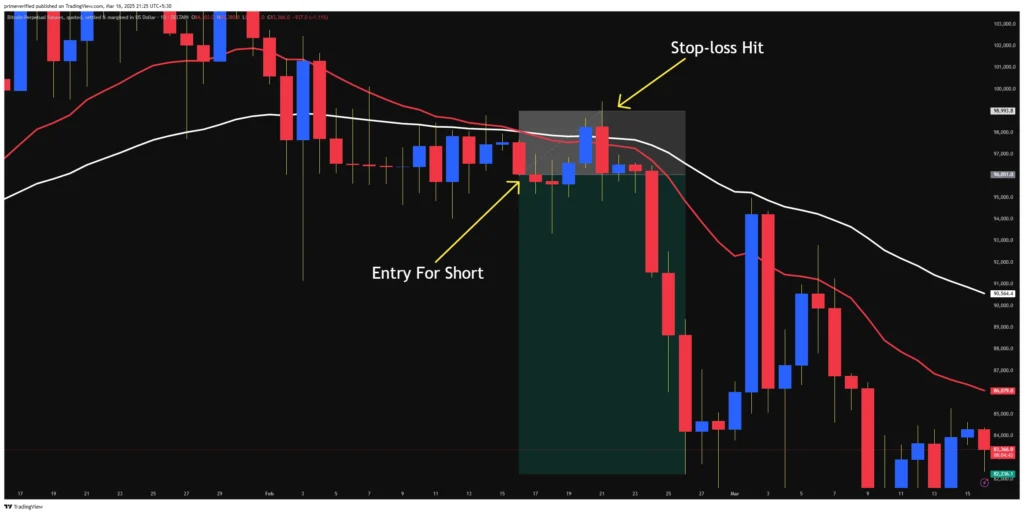
- I should remember that a crossover strategy simply indicates a change in trend. It doesn’t signal entry at the exact crossover point or candle close.
- Most of the time, the market hits the stop-loss first and then rallies, trapping early entries and collecting liquidity to fill more orders.
- Hint: According to the image, the market often forms an M-shaped pattern based on direction and then the real move happened.
- Once the crossover provides trend information, I should focus on candlestick patterns and market behavior to identify trap zones, stop-loss hunting areas, and liquidity grab zones.
4 – How do internet trading videos mislead us by making the crossover strategy seem too simple, as if we can enter at point A, exit at point B, and profit easily every day?
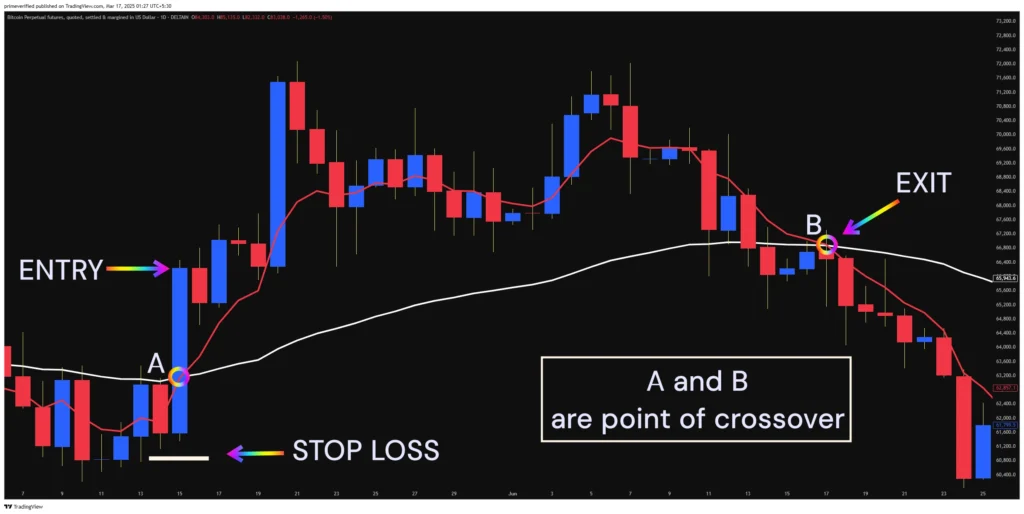
First, carefully analyze the image and question whether simply entering at point A and exiting at point B makes sense?
- Entry Logic:
- Should I enter at the candle close or immediately at the crossover?
- What about if the candle is too big or only the wick got crossed?
- If I enter just at the crossover, the running candle could close 1000 points downward. What will I do then?
- Stop-loss Logic:
- Should I place the stop-loss below the big candle and risk big points unnecessarily?
- Where should I place the stop-loss if multiple small candles are aligned below the main entry candle?
- Profit-Booking Logic:
- Should I book profits using a risk-reward ratio or wait for the next opposite crossover?
- Sometimes it may fulfill your risk-reward, and sometimes it may not. It could give big points on the next crossover, but in the long run, it can cause FOMO, confusion, and poor decision-making.
- Risk-Reward Logic:
- Here, 1:1 RR isn’t enough. A minimum 1:3 RR is needed for long-term profitability.
So here, there are multiple risks, confusion and higher failure rate to become success.
5 – Examining a trader’s strategy on a chart using only crossovers, without candlesticks, to assess the probability of profitability.
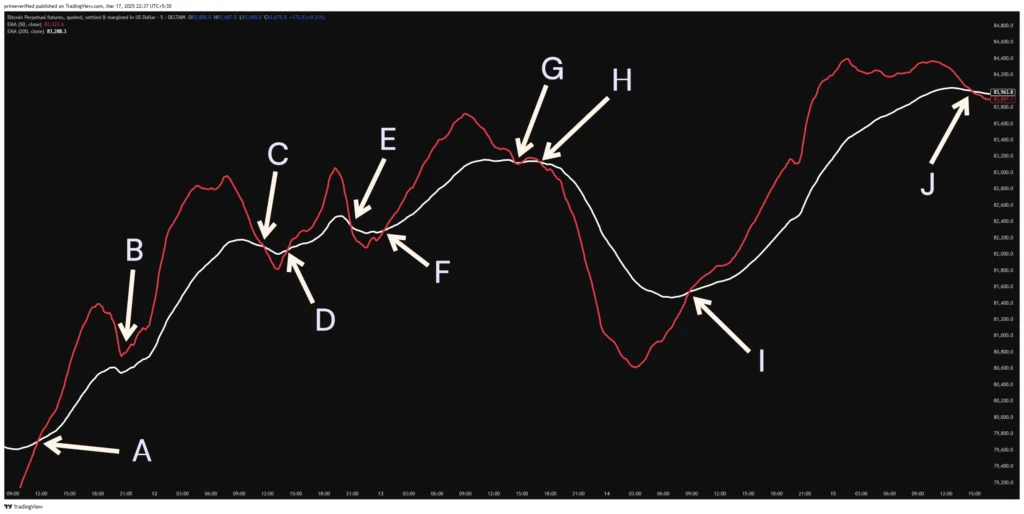
Let’s see how FOMO, confusion, and decision-making affect a trader’s mind while using moving average crossover strategies.
- Point A: Trader takes a long entry at the crossover.
- Point B: Seeing the crossover structure, he quickly exits his position due to FOMO profits.
- (Here, he made small profit.)
- After he exit his position, the price continues rising till Point C.
- (Greed mindset kicks-in watching the move.)
- Point C: He enters a short position at the crossover with double quantity due to greed mindset that he had missed earlier profits.
- (Missed his earlier profit from Point B to Point C.)
- Point D: Price moves against him, he won’t exit thinking that it is a minor upside pull back. Later, he exited beyond his stop-loss level.
- (Here, he losses his previous profits + made an extra loss due to doubled quantity.)
- Point E: He again enters short position with doubled quantity because of recovery and revenge mindset.
- Point F: Price moves against him again, leaving him confused. His mental and physical energy is drained, but he still doesn’t exit.
- (He thinks that I still have money in my account, I can recover.)
- Again exits with even bigger losses due to double quantity.
- (Now, he has made 2X losses.)
- Point G: He takes a long position with whatever money left in his account to recover the 2X loss because he now thinks that trend is so strong and still moving in the upside direction.
- (Here, he only thinks about recovering losses and forgets to take a normal trade to make a profit.)
- (Here, he lost his patience, revenge and desperation kicks-in.)
- Point H: A bearish crossover occurs, but he refuses to exit and continues holding the losing position, believing it’s just an upside price action trend. A few minutes later, his account gets liquidated (blown).
- Point I: Now a bullish crossover happens which is a big strong and healthy move.
- (But he has no money left in his account to enter.)
- Point J: What do you think, he will do here? Just watch…!!
- (Here, he will not analyze his mistakes or rules because his mind and body energy are exhausted.)
- (Also, no money left in his account, then why he review his trades and this cycle repeats endlessly for him.)
Moral: For every crossover there are two participants – buyer (taking long position) and seller (taking short position), without it price can’t move. One party has to lose to make other party win at the end (Reality of trading).
SMA vs EMA: A Concise, Practical Talk.

Important Note: Considering whether SMA or EMA is better, there is no definitive answer as it depends on how you use it and which works best for you.
Let’s quickly see how we use moving averages:
- We use single moving average to determine the trend.
- We take a trade if a candlestick closes above or below the single moving average according to our strategy.
- We use moving average crossover to take long or short trades.
So, What is the most essential point to focus on in moving averages to use them correctly?
First, it is important to understand that there are plenty of moving averages, each designed for different trading styles and market conditions.
Here are names of some moving averages:
- Simple Moving Average (SMA)
- Exponential Moving Average (EMA)
- Weighted Moving Average (WMA)
- Smoothed Moving Average (SMMA)
- Hull Moving Average (HMA)
- Linear Weighted Moving Average (LWMA)
- Triangular Moving Average (TMA)
- Kaufman’s Adaptive Moving Average (KAMA)
- Volume-Weighted Moving Average (VWMA)
- Arnaud Legoux Moving Average (ALMA)
To use moving averages effectively for a consistent trading strategy, follow these key rules to keep it simple and clear.
Strict Rules to follow:
Rule 1: Choose either one.
- Choose any moving average from the list that suits your trading style and aligns with your back testing results. Then, create a strategy where you enter a trade in the direction of the trend when a candlestick closes above or below the moving average. (example: single SMA)
OR
- Choose any one moving average twice with different lengths if you want to create a crossover strategy. (example: EMA 20 & EMA 50)
OR
- Choose any two different moving averages with different lengths if you want to create a crossover strategy. (example: VWMA 30 & EMA 100)
RULE 2: Define a fixed length for your moving averages.
- For a single moving average, choose from 5, 9, 10, 20, 34, 50, 100, 150, or 200 —whichever aligns with your strategy.
- For a crossover strategy with two moving averages (same or different), use combinations like 20/50, 50/100, or 50/200 — whichever best fits your strategy.
RULE 3: Define a strict timeframe for trading, whether for scalping or swing trading.
- For Scalping – You can use 1Min, 3Min, 5Min, 15Min.
- For Swing/Positional – Use 30Min, 1H, 2H, 4H.
RULE 4: Select a risk-reward ratio for long-term profitability.
- DO’s – Use a minimum 1:3 risk-reward ratio or higher. Choose one and stick to it no matter what. Once you enter a trade, it should either hit your stop-loss or target. That’s it.
- DON’T – Don’t use less than a 1:3 risk-reward ratio, as great mentors have proven with logic that it leads to long-term inconsistency.
Rule 5: Select a risk and money management rule to protect your capital.
- Only risk 0.5%, 1%, or 1.5% of your capital per trade, never more than this. Calculate your risk and keep it in front of you. Never assume or take a trade randomly, no matter how promising a 10X move looks on the chart.
- Take only one trade per day, as there’s usually only one big move. If you miss it, do nothing and wait for the next day.
RULE 6: Select the best trading period of the day based on market volatility and your strategy.
- Backtest and identify trading periods with high volume, liquidity, and volatility. For example, if you observe that 1:30 PM to 3:30 PM consistently offers high-probability trends, stick to it strictly.
- Do not trade even a second before or after, or you’ll end up gambling.
Remember, psychology shapes your strategy, and strategy determines your outcomes.
Ok…That’s all. My experience, My research and My journal notes. I will work more on my trading psychology first. This is boring, but I will keep going forward.